Contact

CaviTAU®
Imaging ultrasound measurement of jawbone density
The functionality
Ultrasound-based imaging has been a safe and minimally invasive technology in medicine since the 1940s. CaviTAU® does not use the standard ultrasound technique, which evaluates the range or background of reflected sound signals, but instead picks up sound waves that remain after the sound has completely traversed the bone. This technique is based onsound penetrating dry and solid bone tissue faster than water (or liquid fat in fat cells) or softened bone tissue. Therefore, fatty-degenerative osteonecrotic and osteolytic osteopathies (FDOJ/“NICO”), with many hollow, air-filled cavities and dry and fibrous medullary changes, can be detected with CaviTAU®. CaviTAU® is thus a safe and effective imaging test method for alveolar cancellous bone.
CaviTAU® is a measuring device for three-dimensional and X-ray-free depth diagnostics used by dentists
This kind of ultrasound representation of jaw regions allows the representation of areas of jaw inflammation with radiation-free diagnostics. Examinations that are carried out with CaviTAU® sonography devices indicate any inflammatory or degenerative jaw processes, provide reliable information on bone quality and are scientifically proven.
The reliable method of measuring bone density before using a dental implant makes the CaviTAU® sonography device a valuable companion in implantology. It makes a major contribution to avoiding negative implantology results from the outset.

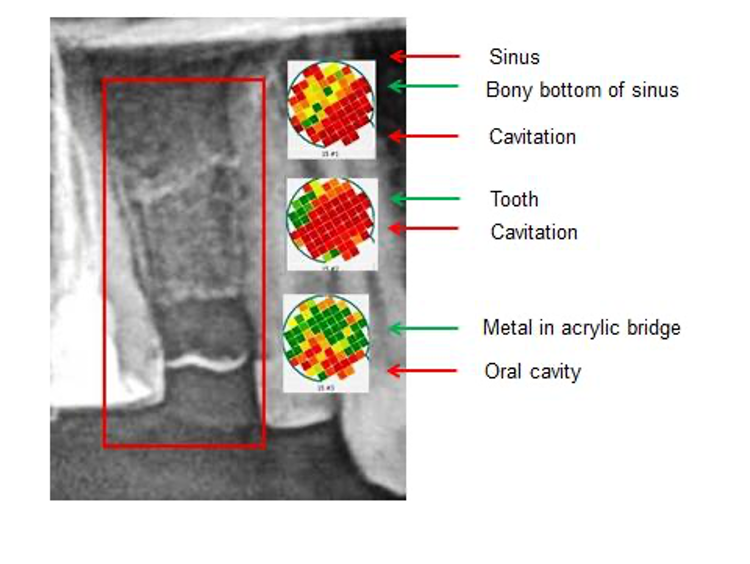
Figure 1: Detailed colour schemes of anatomical structures with different densities in upper jawbone seen through the new CaviTAU®
Quick detection and localization of cavitations
CaviTAU® relates to detecting and locating dental cavitations in jawbones using Through-Transmission Alveolar Ultrasonography (TAU). CaviTAU® generates an ultrasound pulse and passes the frequency through the jawbone. The pulse is detected and monitored subsequently by an ultrasound receiving unit. Attenuations of the amplitude of the pulse are indicative of pathological changes in the jawbone. The results are displayed on a color monitor, showing different colors according to varying degrees of attenuation (Figure 1 and 2).
CaviTAU® is a worldwide unique set of instruments in dental medicine which repeatedly reaches its limits with X-ray technology
Old inflammations that have not healed, for example after tooth extractions, not infrequently develop into areas of inflammation that repeatedly elude X-ray findings. In contrast to the ultrasound devices used in medicine – the sound waves of the CaviTAU® device specifically penetrate the soft tissue (cheeks) and the jawbone in such a way that hard bone can be distinguished from soft bone.
This allows the localization of so-called cavities in the jawbone, which in turn are known to be home to so-called fatty degenerative osteonecroses/osteolyses (FDOKs).
CaviTAU® is a scientifically validated procedure that has been proven with extensive data material from practice and laboratory. Numerous scientific papers prove its function and furthermore describe CaviTAU® findings as the more precise method for the reliable localization of FDOKs.
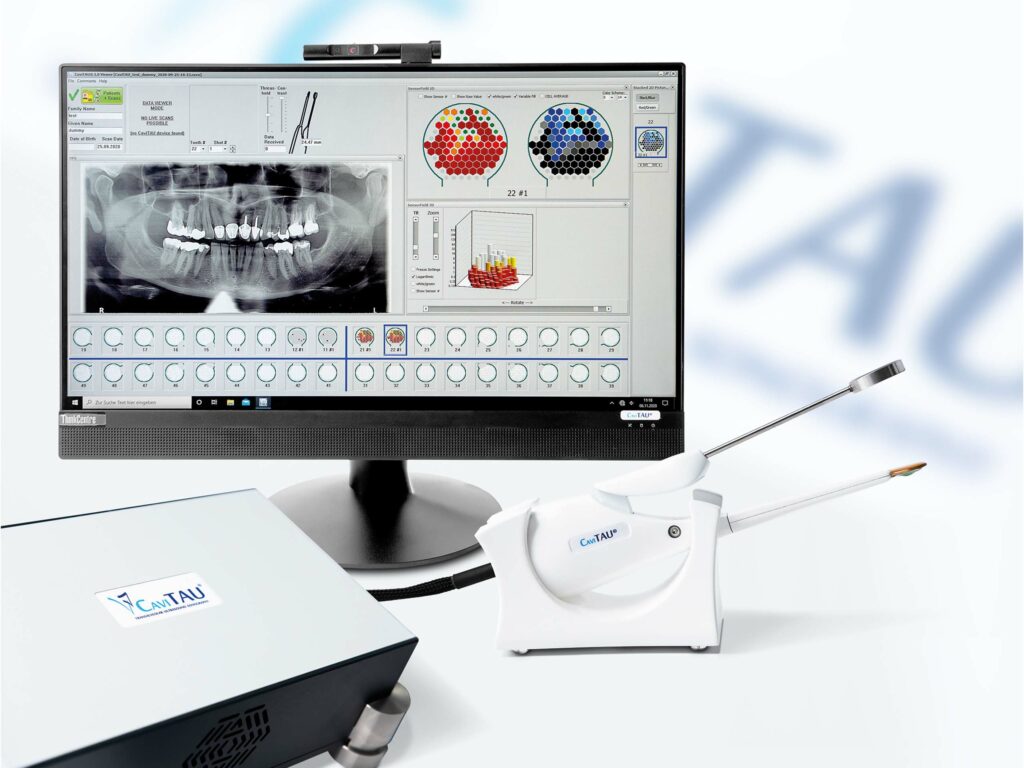
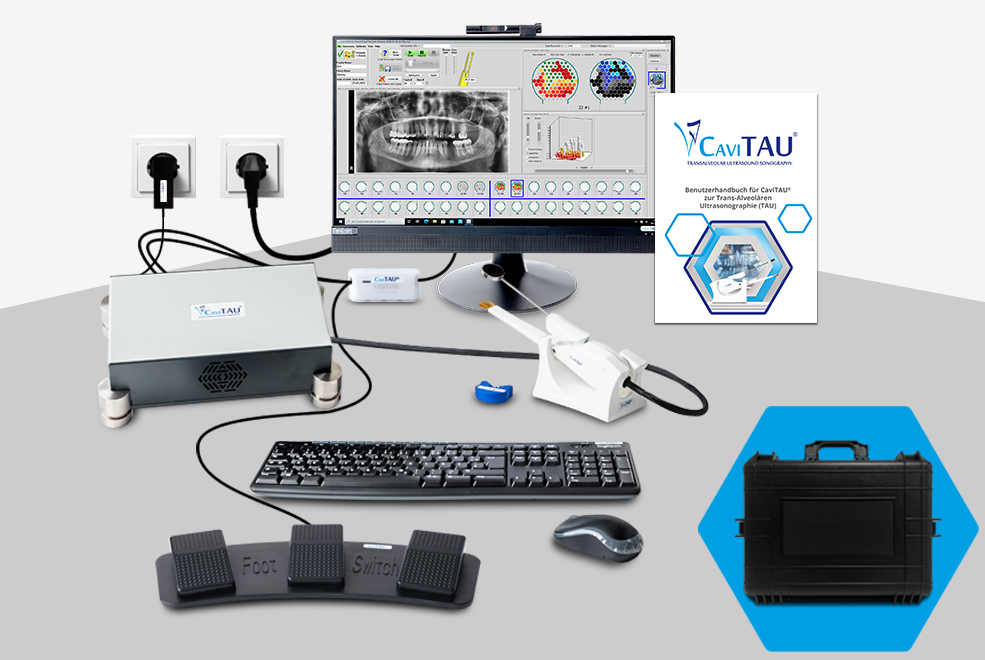
The CaviTAU® medical device is a system consisting of the following components.
- Base unit incl. foot switch/mouse/keyboard with radio link
- Handpiece incl. gel cushion
- Screen/software incl. graphical user interface (GUI)
- Packaging and identification including user documentation
The intraoral ultrasound measurement unit contains an ultrasonic transmitter and an ultrasonic receiver e.g., “measurement unit”. The transmitter and receiver are in a fixed geometric position with each other so that they clearly define their role.
In CaviTAU®, the measurement unit should ideally be in a coplanar position. In order to provide a clearly defined, fixed geometric position, the two parts of the measurement unit are connected. At least one arm is rotatable so that the two parts of the measurement unit form a gripper. The use of rigid components makes the measurement unit extraordinarily stable and virtually eliminates the possibility of the receiver suffering a mechanical malfunction.
The coplanarity of the transmitter and receiver is an essential attribute of CaviTAU®’s design. When both parts of the measurement unit are in the optimal position, the gripper is slightly compressed to ensure acoustic conductivity between the measurement unit and the jawbone.
CaviTAU® is an indispensable tool for detecting chronic inflammation in all immunological system diseases
Not only the unrecognized bland jawbone osteopathy in kind of fatty osteolytic NICO-Osteonecrosis can become a systematically stress factor, but incompatible materials or drugs often lead to a derailment of the immune system and, in the long term, also to the development of FDOKs. Thus, numerous immune diseases can be explained or correlations uncovered by findings with the CaviTAU® device.

Safe and easy handling
The new CaviTAU® device ensures easy handling, making it possible to place the evaluation in the hands of assistant personnel. By means of targeted training and education, CaviTAU® therapists are able to learn how to use the device safely and apply the interpretation of the evaluation in just a few training sessions.

Accurate and meaningful results
With the new CaviTAU® device – the highest priority has been given to the sensitivity of the appliance and the evaluation method used. Through a new, innovative design of the measuring unit and through new ways of ensuring good acoustic conductivity between the patient’s jawbone and the appliance – precise and meaningful results are obtained, enabling the therapist to base his diagnostics on them.